
Carrier report example
A practical starting point for the next account conversation.
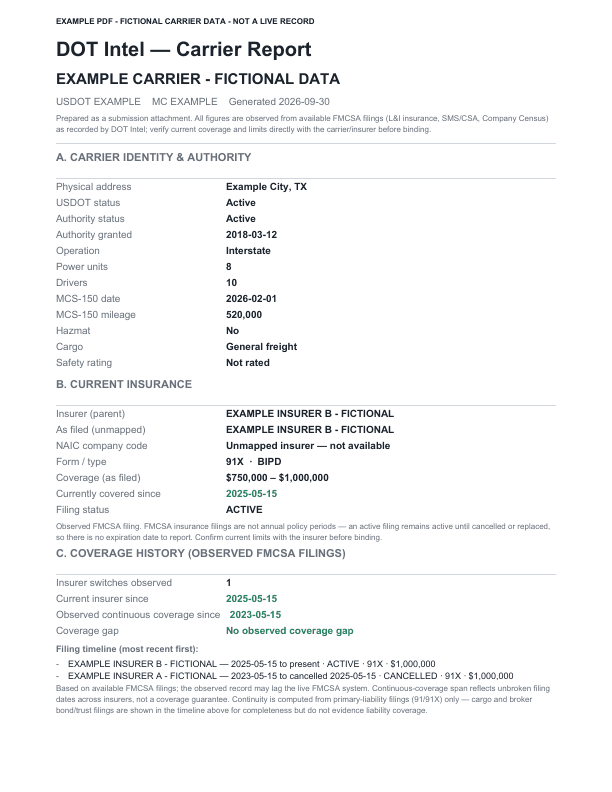
Open an example produced with DOT Intel’s carrier-report layout. Review the filing history, fleet, safety information, and account questions together before deciding what needs a closer look.
Observed filings and estimated renewal timing are different. The report explains those limits; confirm current coverage, renewal dates, and market appetite with the appropriate parties.
Example PDF · fictional carrier data. This illustrates the report format; it is not a live carrier record.
Earlier guides
These published materials cover research methods and supporting workflows. Guides tied to a retired offer are unavailable until they are rewritten for the current plan. Use current pricing for today’s offer and allowances.
White paper · read or listen
Winning the Trucking Insurance Data War
A longer introduction to using public filing information for account research, territory planning, and renewal conversations. Includes an audio edition.
White paper · Design
The Lead Capture Playbook
An optional lead-capture workflow for teams using DOT Intel’s built-in pipeline. You can also use carrier reports and account research alongside your existing agency systems.
Read the Lead Capture PlaybookTrucking intelligence tools and guides
Go directly to the workflow or evidence you need.
The guides
Click any topic to expand and read in full.
Data Fundamentals Guide
Navigating the Trucking Insurance Universe
8 min · expandcollapse
Data Fundamentals Guide
Navigating the Trucking Insurance Universe
1. Introduction: The 1.7M Carrier Universe
The trucking insurance market is a high-volume, fragmented digital ecosystem. Every insurance professional in the United States works within the same universe of approximately 1.7 million FMCSA-registered motor carriers. While the data describing these carriers is public, it is often disorganized and stale. In this industrial landscape, the difference between agencies that grow and agencies that merely "grind" is defined by speed-to-knowledge. The competitive edge does not come from exclusive data access, but from the ability to see change first and act on it through an organized mental model. On any given day, the market experiences massive shifts—such as the 1,300+ real-time changes, including 177 insurer switches, observed by the DOT Intel engine in a single 24-hour window.
KEY FACT: THE CARRIER POPULATION
Total Registered Universe: 1.7 Million motor carriers.
Active For-Hire Carriers: 350,000+ (The core professional focus).
The Growth Lever: Success is predicated on identifying "winnable" carriers the moment a status change occurs, effectively transforming raw data into a pursuit strategy.
To navigate this universe, one must first master the "shared key" that unlocks every record: the USDOT number.
2. The "Shared Key": Understanding the USDOT & FMCSA Ecosystem
The USDOT number serves as the universal identifier for every motor carrier. It is the only consistent link across a fragmented regulatory environment where information lives across disparate systems like SAFER, BASIC, and L&I. A sophisticated professional must also understand Insurer Mapping. The industry currently tracks filings across 56 "child" insurance entities, but these normalize into 32 "parent" companies (e.g., multiple writing companies roll up to a single market-facing parent — for example, several Berkley operating units normalize to one Berkley parent). Understanding this Parent/Child relationship is the only way to calculate true carrier-of-record filing share and understand the actual momentum of a competitor.
The Data Fragment Map
| Source | What it tells us | Key Data Points |
|---|---|---|
| SAFER (MCMIS) | Fleet Census | Power Units (truck count), driver count, and operation radius. |
| L&I (Licensing & Insurance) | Authority & Filings | BMC-91X (Liability), BOC-3 (Process Agents), and Authority status (Active/Revoked). |
| BASIC (SMS) | Safety & Risk | 24-month safety panel, crash history, and inspection results. |
While these sources provide the facts, the real value lies in how we interpret the "delta"—the change between what was true yesterday and what is true today.
3. Core Concept: Recorded Events vs. Modeled Signals
A fundamental skill for the insurance professional is distinguishing between a historical fact and a probabilistic estimate. This distinction is most critical regarding policy expiration. The FMCSA publishes no expiration dates. Therefore, no provider has "real" X-dates; they are all estimates.
- • Recorded Events: Verifiable facts documented in the public record (e.g., an insurance cancellation or a fleet size increase).
- • Modeled Signals: Probabilistic estimates derived from patterns (e.g., estimating a renewal window based on the effective date of a previous filing).
Data Types Comparison
| Recorded Events | Modeled Signals |
|---|---|
| Example: Recently Lost Coverage (Cancellations) | Example: Likely X-Date (Renewal Window) |
| Nature: Verifiable, historical fact. | Nature: Probabilistic estimate (Model). |
| Certainty: Absolute; the event is "on the record." | Certainty: Variable; based on confidence ratings. |
| Strategic Use: High-intent, immediate outreach. | Strategic Use: Planned displacement at renewal. |
Understanding these signals dictates the timing of a producer's outreach, moving them from reactive cold-calling to proactive territory planning.
4. The Insurance Lifecycle: Windows and Lapses
In trucking, timing is the product. We focus on two primary triggers in the "Highest Intent Funnel" that signal a carrier is ready for a new professional relationship.
- • The Renewal Window (Likely X-Date): Most insurance changes occur during the renewal period. This is the "repeatable play" of displacement—moving an account from a competitor's paper to your own by engaging 90 days before the modeled expiration.
- • Recently Lost Coverage: This is a specific technical gap where a carrier has active operating authority but no current insurance filing on record (observed within the last 90–180 days). These are "highest-intent" moments because the carrier cannot legally operate, creating pre-manufactured urgency.
The Highest Intent Funnel
- • Immediate Urgency: "Recently Lost Coverage" carriers who need a filing now to stay legal.
- • Timed Displacement: Carriers entering the 90-day "Likely X-Date" window.
- • Strategic Fit: Filtering the above by state, fleet size, and safety profile to match agency appetite.
5. Safety and Risk: Decoding BASIC and Readiness
Before a submission is sent to an underwriter, the risk profile must be triaged. This is done through the 24-month safety panel and BASIC alert exposure (ranging from Very Low to Very High). The three most important risk factors an underwriter evaluates are:
- • 24-Month BASIC + Crash History: High-frequency violations in categories like Unsafe Driving or HOS (Hours of Service) signal a deteriorating risk.
- • Filing Count: Frequent insurer switches can signal "market-hopping" or instability.
- • Submission Readiness: A score (0–100) identifying gaps in a carrier's file (e.g., missing equipment schedules) before it hits an underwriter's desk.
The "So What?": Clean, complete files build an agency's reputation. Underwriters prioritize submissions from agencies that consistently provide high-readiness files, leading to faster quotes and better hit ratios.
6. The Strategic Advantage: Speed-to-Knowledge
"Change is the product." In a market of 1.89 million rolling filings, the ability to see a fleet move, a cancellation, or a carrier-of-record shift before the competition is the only sustainable advantage. Retention and displacement run on the same signal: the morning you see a change is the morning you act.
Strategic Playbook
Win More Accounts (Timing + Fit)
The "Winning Play" combines the Recently-Lost-Coverage list for immediate intent with the Likely X-Date list for displacement. By checking Placement Fit against 60+ insurer-parent rules before shopping, you ensure you are leading with the markets that actually have an appetite for that specific risk.
Manage Retention (Watchlists + Alerts)
By placing your book on watchlists, you utilize the "delta engine" to see coverage losses or insurer switches on your own clients the moment they happen. This allows you to defend your accounts before a competitor closes the deal.
Market Intelligence (Carrier Momentum)
Use Territory Planning to monitor which insurers are growing or shrinking. When a major insurer's filing share drops in your state, it signals capacity leaving the market—allowing you to predict pricing shifts and move your clients to surging entrants months before the "hard market" becomes common knowledge.
Mastering these fundamentals transforms a producer from "grinding" through raw lists to "growing" a high-margin, data-driven practice.
7. Glossary of Essential Terminology
- • BASIC Alerts: Safety signals (Unsafe Driving, HOS, etc.) derived from a 24-month panel of inspections and crashes. Alerts are ranked from Very Low to Very High exposure.
- • BMC-91X: The standard federal insurance filing that serves as public proof of a carrier's primary liability coverage.
- • BOC-3: A federal filing designating "Process Agents"—legal representatives upon whom court papers may be served in each state the carrier operates.
- • FMCSA: Federal Motor Carrier Safety Administration; the governing body responsible for commercial vehicle safety and the source of all industry data.
- • Power Units: The number of trucks/tractors a carrier operates; the primary metric for fleet sizing and market appetite.
- • USDOT: The "shared key"; a unique identifier for every motor carrier used to link fragmented data across government systems.
- • X-Date (Modeled): The estimated expiration date of a policy. Since the FMCSA does not publish these, they are modeled based on filing effective dates and historical patterns.
From Friction to Flow
The DOT Intel Workflow Transformation
8 min · expandcollapse
From Friction to Flow
The DOT Intel Workflow Transformation
1. The "Broken Universe" of Trucking Insurance
In the high-stakes world of commercial trucking insurance, information is abundant, but clarity is scarce. The industry currently operates in a state of "fragmentation" where the data required to evaluate a risk is scattered across the FMCSA, SAFER, BASIC, and various insurance filing databases. For the insurance professional, data is currently a burden—a manual grind of constant tab-switching and guesswork that eats into the only metric that matters: speed-to-knowledge. In trucking, the first credible quote usually wins. When an agency spends days "list-wrangling" or "tab-hopping," they aren't just wasting time; they are actively losing revenue to faster, more organized competitors.
| Professional Role | The 'Manual Grind' (Pain Points) |
|---|---|
| Producers | Burning entire weeks researching fleets only to discover at the point of submission that the carrier doesn't fit the agency's appetite. |
| Underwriters | Forced to triage every application by manually assembling facts from eight different FMCSA tools, creating a bottleneck for every quote. |
| Territory Managers | Relying on stale, anecdotal reports and last quarter's production decks to make strategic bets on market moves. |
To bridge this gap, agencies must move past raw data and adopt a unified "intelligence layer" that organizes these scattered signals into a strategic flow.
2. The Core Philosophy: See, Know, Work
Every agency works the same universe of 1.7 million FMCSA-registered carriers using the same public data. The difference between agencies that grow and those that grind is how they process that information. DOT Intel's philosophy is built on three pillars designed to turn data into a competitive advantage:
- • See it first: The platform monitors the entire carrier universe every morning to spot real-world changes as they happen.
- • So what? Speed-to-knowledge is speed-to-quote; seeing a change first allows you to offer a solution before the incumbent even knows there is a problem.
- • Know what to do: Raw data is transformed into clear "lead reasons" and recommended actions.
- • So what? This eliminates "analysis paralysis," ensuring your team spends 100% of their energy on high-intent pursuits rather than research.
- • Work it in one place: Research, prospecting, and submission tasks are consolidated into a single environment.
- • So what? Professionals regain hours of administrative time, allowing a 5-person agency to perform with the output of a 15-person shop.
This philosophy is powered by an intelligence engine that processes data through four distinct stages.
3. The Intelligence Engine: How Raw Data Becomes Insight
DOT Intel transforms 1.7 million FMCSA records into "auditable signals." This is a critical distinction for the Producer: because every signal is auditable, you can cite specific, real-world filing dates to a prospect. This immediately increases your credibility on the phone, moving you from "cold caller" to "informed advisor." The system processes these signals through four steps:
- • Ingest: Pulling raw filings, authority records, and safety signals on their natural cadence.
- • Normalize: Cleaning and mapping records, linking 32 insurer parents and 56 children to the correct carriers.
- • Analyze: Distinguishing between modeled data (Likely X-Dates) and observed facts (Cancellations) to provide an honest look at the market.
- • Activate: Turning these insights into watchlists and reports that teams can act on immediately.
The Live Data Canvas
The platform maintains a real-time view of the industry, tracking critical metrics such as:
- • Filings Activity: Insurance and authority filings over the last 52 weeks (averaging +177 switches per week).
- • Carrier Coverage: Active carriers tracked by state (e.g., 178,500+ in Texas).
- • Risk Signals: Distribution of carriers by safety alert exposure (Very Low to Very High).
These signals specifically empower the frontline Producer to master the growth cycle.
4. The Producer's Edge: Mastering the Growth Cycle
Traditional prospecting is a game of "list-wrangling"—buying static lists that are outdated before the first call is made. DOT Intel replaces this with "timing plays" driven by live data. Producers use Estimated Renewal Windows (honestly modeled confidence ratings) to reach accounts while they are actually shopping. However, the highest-intent signal in the engine is Recently Lost Coverage. Unlike a modeled date, this is an observed fact: the carrier's insurance has been cancelled, and they cannot legally operate.
| Feature | The "Old Way" (Manual Research) | The "DOT Intel Way" (Intelligence Layer) |
|---|---|---|
| Research Time | 30 minutes per account across 8 browser tabs. | Under 3 minutes via the Carrier Workspace. |
| Prospecting | Cold calling static lists with no context. | High-intent "timing plays" using observed cancellations. |
| Lead Accuracy | "Best guess" based on stale data. | Auditable signals traced to real FMCSA filings. |
| Workflow | Notes in spreadsheets; history is lost. | Integrated CRM organized by USDOT and X-Date. |
Once an account is identified, the focus shifts to ensuring it can actually be placed.
5. Underwriting and Placement: Precision over Guesswork
Winning the call is useless if the account cannot be insured. The Placement Fit tool uses observed filing patterns from 60+ insurer parents to predict which markets have an actual appetite for a carrier's specific risk profile. This prevents "wasted cycles" and protects your agency's reputation with your carriers.
Key Insight: The Readiness Score
The Readiness Score (0–100) is your agency's reputation, systematized. It identifies the exact data gaps in a submission before it reaches an underwriter. Underwriters prefer "clean files" and will prioritize agencies that consistently send complete packets. A high Readiness Score ensures you are perceived as a high-quality partner, directly increasing your hit ratios and speed-to-quote.
6. The Strategic View: Territory and Market Intelligence
While Producers win accounts, Managers use the platform to navigate the broader market. By monitoring Carrier-of-Record Momentum, managers can see capacity shifts—such as a major insurer quietly exiting a class—months before it becomes common knowledge.
| Market Signal | Strategic Response |
|---|---|
| Shrinking Carrier-of-Record | Capacity is leaving the market; move affected clients early to avoid price hikes. |
| Surging New Entrant | New appetite is arriving; use this as placement leverage for better pricing. |
| Uninsured Opportunity | Identify ZIP codes with high concentrations of carriers lacking active filings. |
| Appetite Shifts | Adjust your "Prospect Builder" filters to target segments where incumbents are retreating. |
7. Command: The Central Nervous System
Command is the trucking-specific CRM that prevents institutional memory loss. Unlike generic sales tools, it is built around USDOT numbers and the recurring nature of the insurance cycle.
- • X-Date Recycling: If a deal is "lost-for-now," the system automatically recycles the lead, returning it to the Producer's feed months later—just before the next renewal window opens.
- • DOT-Linked Logic: Every note, task, and submission is linked to the live filing history of the DOT number.
- • Automated Monitoring: Any change to a client's filing status (cancellation, switch, or fleet growth) triggers a daily alert so you hear it from your dashboard—not from a competitor.
8. Conclusion: The Compound Effect of Intelligence
The transformation from friction to flow is the result of multiple tools working in a single "compounded" play: You identify a Recently Lost Coverage signal (highest intent), verify Placement Fit (right market), and ensure a high Readiness Score (clean file).
In this industry, "change" is the actual product. The agency that sees the change first, knows how to interpret it, and works it in one place is the agency that wins.
By the Numbers
- • 1.7 Million: Motor carriers tracked in the FMCSA universe.
- • 1,300+: Real-world data changes surfaced by the engine every single day.
- • 1.89 Million: Insurance filings monitored in a rolling 4-year window.
- • 177: Number of carriers observed switching insurers in a typical week.
- • 32 / 56: Insurer parent/child relationships mapped for precise appetite matching.
Trucking Insurance Market Dynamics
A Strategic Analysis of Insurer Momentum and Capacity Shifts
9 min · expandcollapse
Trucking Insurance Market Dynamics
A Strategic Analysis of Insurer Momentum and Capacity Shifts
1. The Architecture of Market Intelligence: From Anecdote to Filing-Driven Data
In the modern commercial transportation landscape, the volume of raw data is no longer the bottleneck; the deficit lies in synthesis. Every producer in the industry operates within the same universe of 1.7 million FMCSA-registered motor carriers, yet most remain tethered to fragmented public sources. The competitive advantage in the 2026 landscape has shifted decisively toward "speed-to-knowledge." Real growth mandates a transition from broad-market guessing to a unified intelligence layer that normalizes disparate signals into actionable answers. Agencies that rely on manual lookups are not just slow; they are strategically blind to the 1,300+ daily signals that define winnable business.
The following table contrasts the legacy approach to data management with the modern intelligence model:
| Traditional Data Management | The Intelligence Layer |
|---|---|
| Manual Lookups: Researching a single account takes 20–30 minutes across 8+ browser tabs (FMCSA, L&I, SAFER, BASIC). | Automated Normalization: All data is consolidated into a single screen with the insurance story told as a chronological timeline. |
| Stale Lists: Relying on static spreadsheets or exported lists that were accurate weeks or months ago. | Daily Delta Engine: Monitors the entire universe every morning for 1,300+ daily signals and 177+ insurer switches. |
| Fragmented Systems: No shared key between safety panels, operating authority, and BMC-91X filing records. | Normalized Data: 1.89M filings mapped to 32 insurer parents and 56 children for a 360-degree market view. |
This shift to a "delta engine" fundamentally redefines the producer's daily workflow. Instead of grinding through static databases, producers are alerted to real-time motion—such as a specific insurer switch or a fleet-size change—the moment it occurs. This visibility allows for "surgical strikes" on accounts that are actively in flux. While broad data provides the scenery, the true indicator of market health and opportunity lies in the specific movement of insurer-of-record filings.
2. Quantifying Insurer Momentum: Filing Share as a Leading Indicator
To navigate this market with precision, firms must prioritize "filing share" as their primary metric for tracking market appetite. While "premium share" is often cited in boardroom decks, it is a lagging indicator of past success. Conversely, filing share serves as the primary leading indicator of current insurer intent. By monitoring carrier-of-record filings in real-time, agencies can detect where capacity is flowing long before it reflects in financial reports or carrier-rep talking points. Insurer momentum is distilled into three strategic signals:
- • Growing Momentum (Appetite Arriving): Indicated by a surge in new filings. This is a strategic signal of an insurer seeking growth, presenting a high-probability placement opportunity and a potential pricing-leverage point.
- • Stable Momentum: Indicates a consistent, disciplined market presence. These insurers represent reliable "bedrock" partners for renewals that fit their established footprint.
- • Shrinking Momentum (Capacity Exit): Identified by a contraction in filing counts over an 18-month trend. This is a pre-emptive signal of a "quiet retreat," allowing producers to anticipate harder placements and firmer pricing before they become common knowledge.
The value of the 18-month trend capability is found in predictive capacity management. If filing counts shrink in a specific segment—for example, the mid-fleet band—an agency can proactively move its book before a "quiet retreat" turns into a "hard exit." This foresight ensures the agency is leading the market rather than reacting to it.
3. Regional Capacity and the Mechanics of Market Disruption
Insurer appetite is rarely monolithic; it is a patchwork of territory-level preferences. An insurer may be aggressive in Texas while simultaneously shedding exposure in Illinois. Strategic intelligence requires a granular view of all 51 states to identify where regional capacity is shifting. Understanding these local mechanics is the only way to manage market disruptions before they compromise client retention. When a capacity exit is detected, the "Market Disruption Alert" workflow enables a systematic response:
- • Identify the Exit: Monitor filing-share momentum to pinpoint which insurers are shrinking in a specific state or cargo class.
- • Filter Affected Accounts: Instantly isolate clients insured by the retreating carrier who match specific power-unit counts or cargo types.
- • Match Replacement Markets: Utilize observed filing behavior to identify replacement insurers currently growing in that specific territory.
- • Execute the Rescue Play: Engage the client early to set expectations and move them to a stable market before the coverage lapse becomes critical.
Furthermore, by utilizing "uninsured-opportunity sizing," territory managers can pivot outreach budgets toward segments where insurer momentum and fleet density are highest. This allows for high-conversion "rescue" plays, specifically targeting carriers identified by the "Recently Lost Coverage" signal—those who are legally unable to operate and require immediate coverage to survive.
4. Optimization of Placement Discipline through Observed Alignment
Placement discipline is a fundamental margin-protection strategy. By reducing "misfires"—submissions sent to markets with zero current appetite—producers preserve their credibility with underwriters and decrease internal friction. This is operationalized through a "Placement Fit" engine powered by 66 observed-market rule sets derived from real-world filing patterns.
Rather than shopping a risk to five markets and risking three declinations, a producer can provide a data-heavy rationale for their submission that speaks the underwriter's language:
Strategic Rationale for Underwriting
"Based on observed market alignment in the last 18 months, your firm has shown a surging appetite for carriers in the 10–25 power-unit range within this garaging state. This account's BMC-91X requirements match your current filing momentum. Furthermore, our analysis confirms a clean 24-month safety panel with zero BASIC alert exposure, making this a prime candidate for your current mid-fleet growth strategy."
To systematize this advantage, a "Readiness Score" (0–100) is applied to each submission. This score identifies gaps—such as missing driver schedules or radius details—before the underwriter sees them. Cleaner, pre-vetted submissions result in faster quotes and higher hit ratios, ensuring that the agency's reputation for quality is systematized across the entire firm.
5. Predictive Modeling: Timing the Market via Renewal Windows and Lapses
In trucking insurance, timing is the difference between a bound account and a deleted email. The two highest-intent moments in the sales funnel are the "Renewal Window" and "Recently Lost Coverage" signals. Utilizing these triggers allows agencies to transition from cold-calling to scheduled, high-intent timing plays. The following table compares these two critical signals:
| Feature | Source of Data | Strategic Action |
|---|---|---|
| Likely X-Date (Renewal Window) | Modeled: Derived from observed filing effective dates and assigned Confidence Ratings. | 90-Day Displacement: Reach the account as they begin to shop, while they are still on a competitor's paper. |
| Recently Lost Coverage | Recorded Event: Real, observed BMC-91X cancellations in the last 90–180 days with no new filing. | Immediate Urgency: A "call today" list for carriers who cannot legally operate and face immediate regulatory shutdown. |
To maximize this intelligence, agencies must utilize "X-Date Recycling" within their CRM. This ensures "institutional memory" by automatically resurfacing lost quotes at the optimal moment in the next cycle. By transforming past failures into future pipeline, the agency ensures that every lead eventually yields a result, regardless of producer turnover or spreadsheet errors.
6. Conclusion: Systematizing Strategic Advantage
Strategic advantage in commercial transportation is achieved by synthesizing four key plays:
- • Winning Accounts: Precision timing via renewal windows and recorded coverage lapses.
- • Strategic Marketing: Targeting segments where momentum is high and competition is retreating.
- • Account Retention: Using delta-engine alerts to monitor one's own book for carrier switches or safety flags.
- • Market Shift Analysis: Placing business based on 66 observed rule sets of active insurer appetite.
By leveraging a foundation of 1.7 million carriers, 1.89 million rolling insurance filings, and sub-second search capabilities, even a boutique agency can perform with the sophistication of a global enterprise. The "One Intelligence Layer" philosophy dictates that value is not found in raw FMCSA tables, but in the activation of "answers" that drive agency growth. In the 2026 trucking insurance landscape, filing-share intelligence is no longer an optional luxury; it is the essential requirement for any firm seeking to navigate the market with precision, authority, and sustained profitability.
All figures are carrier-of-record filing share from public FMCSA data (never premium share); modeled signals — including estimated renewal windows — are estimates, not confirmed dates. See the full disclaimers.